01
Reliable measurements
Standard units, range checks, and transient-value filtering keep readings consistent and easier to trust.
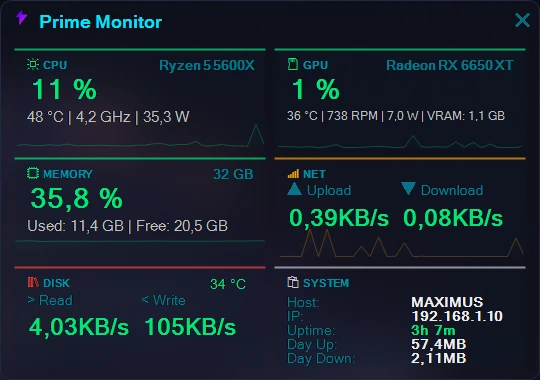
Hardware readings, repeatable benchmark sessions, hotkey workspace profiles, taskbar metrics, game overlays, desktop widgets, history, and secure remote access — in one portable Windows application.
Efficient monitoring
Reads only the sensors required by visible views
RTSS Shared Memory V2
No game-process code injection
Standard units, range checks, and transient-value filtering keep readings consistent and easier to trust.
Read FPS and frame pacing through RTSS without game injection, then save repeatable sessions with average, min, 1% low, 0.1% low, hardware peaks, comparisons, and exports.
View selected metrics from phones, tablets, and browsers on your local network through password-protected remote access.
One app, many views
From compact taskbar readings to detailed history charts, every view uses the same consistent measurements and visual system.
Vertical or horizontal panel layouts, compact taskbar-aligned metrics, multi-monitor placement, separate label/value typography, hover details, click-through, and configurable double-click actions.
Responsive load, temperature, power, memory, and FPS analytics — including the large-value Game Four RTSS-style HUD, seven radial widgets, saved sizing, snapping, topmost, opacity, and clickability.
Run a named, validated gameplay segment; capture frame statistics and hardware summaries; compare it with the previous session; then export CSV or a concise report.
Open a saved combination of panels, widgets, Benchmark Sessions, and Prime HW Monitor with one hotkey, including monitor-aware positions and behavior overrides.
Edit colors, typography, sizing, spacing, borders, opacity, and taskbar presentation with live preview. Theme-aware panels and web surfaces stay coordinated.
Review load, temperature, power, clock, FPS, network, and storage trends over 1 hour, 24 hours, or 7 days, then export history to CSV.
Upload/download speed tests, daily traffic, and a responsive live dashboard for another device or Lively Wallpaper.
A multilingual Data Sources page explains each metric’s source, unit, aggregation, validation, freshness, and RTSS behavior.
Search, expand, and inspect the complete motherboard, CPU, GPU, memory, storage, network, cooling, controller, and battery sensor catalog in a safe live diagnostic view.
Game widgets
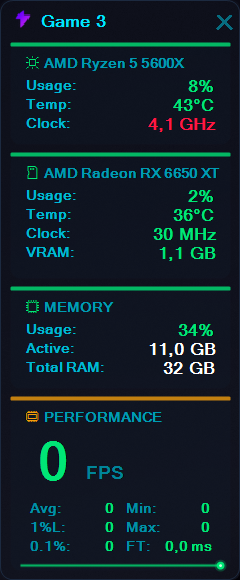
Game 1 and Game 3 combine processor, graphics, memory, and performance readings in clear layouts designed for quick in-game scanning.
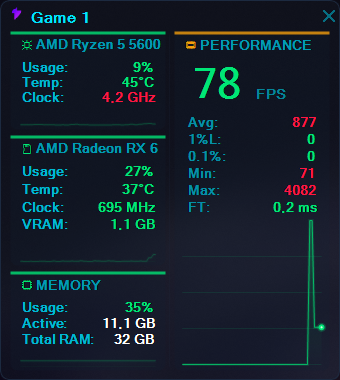
Labels adapt to available width and stay inside the HUD at every supported scale.
Clickable or click-through, topmost, saved positions. Always-on-top works with windowed and borderless fullscreen.
Transparent HUD palettes stay stable while the rest of the app follows your theme.
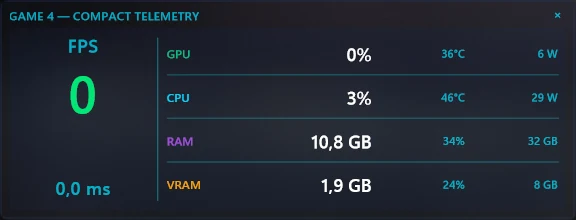
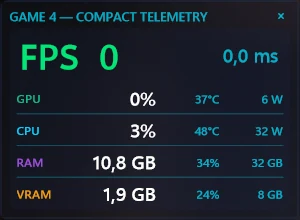
Large FPS and frame-time values sit beside aligned GPU, CPU, RAM, and VRAM readings. Resize once: the same HUD automatically shifts from a wide row layout to a compact stacked view.
Accuracy & idle efficiency
Panels, widgets, taskbar metrics, and the web dashboard all use the same validated measurement data.
Panels, widgets, taskbar metrics, and web sessions request only the measurements they display.
PrimeMonitor selects suitable sensors, converts values to standard units, and filters temporary invalid readings.
Local views and authorized web connections receive the same readings, while unused sensors remain idle.
Real application screenshots
Filter the gallery and open any image for a closer look.
Ready in minutes
Core hardware monitoring, widgets, history, taskbar metrics, and network tools work without RTSS.
Download
Get the latest package from GitHub Releases.
Extract and run
Portable builds need no traditional installation.
Choose your surfaces
Enable the panel, widgets, taskbar, or remote dashboard.
Optional: connect RTSS
Install RTSS when you want FPS and frame-time metrics.
Local-first & open
PrimeMonitor is GPL v3 open-source software. Desktop monitoring remains local. Remote access is optional and configurable; external-interface listening requires password protection.
Common questions
Yes. PrimeMonitor is free and open-source software distributed under the GNU GPL v3 license.
Only for FPS and frame-time statistics. Hardware sensors, widgets, taskbar metrics, history, speed test, and other tools do not depend on RTSS.
No. PrimeMonitor reads the data that RTSS publishes through Shared Memory V2. Compatibility still depends on the game, RTSS, and anti-cheat environment.
Yes. Both can read the same RTSS shared-memory FPS feed. Afterburner can continue overclocking and fan control; PrimeMonitor does not modify those settings.
Widgets are standard Windows desktop windows. Always-on-top works in windowed and borderless fullscreen; exclusive fullscreen cannot show a standard widget above the game.
Yes. Enable the optional web server and open the local address from a phone or tablet on the network. Configure a password before exposing it beyond localhost.
PrimeMonitor v2.1.0
Download PrimeMonitor, choose the views you need, and tailor the monitoring experience to your desktop.
Questions about PrimeMonitor? Contact maximusprimesoftware@gmail.com · Maximus Prime Software